Seven monsoons across 23 twin-cities rain gauges reveal a single, stubborn pattern: in Rawalpindi and Islamabad, how much rain you get depends mostly on how close you sit to the hills.
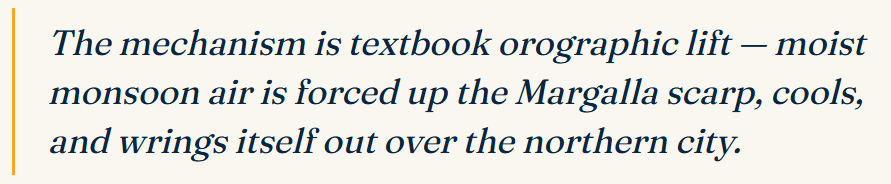
Ask two people in the twin cities how wet last monsoon was and you'll often get two very different answers and both can be right. A gauge tucked under the Margalla scarp and one out on the southern plain are measuring what looks like the same storm season, yet the totals they log are worlds apart. We pulled every gauge with an unbroken record from 2019 to 2025, averaged each one over its complete years, and the reason came straight out of the numbers: terrain writes the rainfall map.
Sit near the Margalla foothills and you collect roughly 1.5 times the annual rain of a gauge on the city's southern edge about a 500 mm difference stretched across barely 20 kilometres. That is an enormous gradient for so little distance, and it is almost entirely the work of the hills.

The gradient, gauge by gauge
Rank the 23 gauges by their mean annual total and the geography sorts itself out. The top of the table is almost entirely the northern Islamabad sectors and foothill sites QAU, F-6, Bharakahu, I-8, G-8, Banigala all of them hugging the Margalla range. The bottom is the southern and outer sectors, from Shah Allah Ditta and F-11 down through the peri-urban Rawalpindi gauges.
Mean annual rainfall, by gauge
Bar = mean · line = year-to-year range · colour = wetness · complete-coverage years only
A monsoon squeezed into one month
The other half of the story is timing. Across the network, roughly 68% of the year's rain arrives in the four monsoon months, June through September and July alone carries about a quarter of the annual total, some 347 mm, close to 1.5× August. Winter contributes little; the westerly pulses that reach us are thin.
Where the rain falls
Core-network mean monthly rainfall (mm)
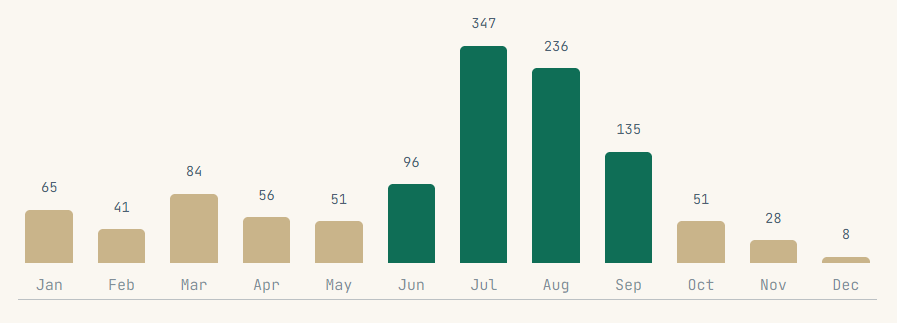
That concentration matters more than the annual average. When a year's total is decided by a handful of July days, the risk isn't a long wet season to manage. it's a few hours of extreme intensity, usually over the same foothill belt that already runs wettest. Averages describe a normal year; extremes decide the bad ones.
What it means for the twin cities
For anyone planning drainage, siting infrastructure, or running early-warning, the gradient is not a curiosity it is the design input. The northern sectors need capacity tuned to genuinely higher loads and flashier response; the same cloudburst that is a nuisance downtown can be a flood event against the hills. And because the wettest sites carry the widest year-to-year spread, thresholds should be set against the extremes each gauge has actually recorded, not a smoothed city-wide mean.
How we did this
Daily readings from 23 Rawalpindi–Islamabad gauges with an unbroken 2019–2025 record were aggregated to monthly totals and cross-checked against source totals (96% agreement within 1 mm). Each gauge's mean annual figure is averaged over its complete twelve-month years only, so partial seasons never bias the total. Networks span Islamabad and Rawalpindi automatic weather stations, PMD gauges, and manual gauges. Peripheral out-of-city stations were excluded to keep the picture strictly to the twin cities.